
One of the most common questions in private cloud environments is how infrastructure cost translates into workload consumption. Organizations want to understand not only how much their platform costs to operate, but also which workloads are consuming the most resources and driving that cost.
VMware Cloud Foundation Operations includes a cost modeling framework that estimates the Total Cost of Ownership for a private cloud platform and distributes that cost across workloads based on resource utilization. This allows administrators and leadership to visualize how infrastructure resources are consumed across the environment.
In many enterprise and federal environments, this information is used as a showback model rather than a chargeback billing system. Instead of directly billing departments for resource usage, the platform provides visibility into how infrastructure capacity is utilized and where optimization opportunities may exist.
This article walks through how cost modeling works within VMware Cloud Foundation Operations, including licensing capacity, cost drivers, cluster base rate calculations, workload showback, and extending the model to include application licensing costs.
All screenshots used in this article have been sanitized to remove environment specific identifiers while preserving the functionality of the dashboards.
Applying Licenses in VMware Cloud Foundation 9 #
Starting with VMware Cloud Foundation 9, licensing is managed through VCF Operations, which acts as the centralized licensing interface for the platform.
Administrators register their VCF Operations instance with the Broadcom Business Services Console, where license entitlements are assigned and applied to the environment. Once licensing is activated, the platform begins tracking the total licensed core capacity available across the infrastructure.
For readers interested in the full licensing workflow, VMware provides a detailed walkthrough of the registration and activation process in the following video.
Video: How to Apply VCF Licensing in VCF Operations
Once licensing has been applied, VMware Cloud Foundation Operations begins monitoring licensed core capacity and infrastructure consumption across the environment. This licensing capacity becomes the foundation for understanding how infrastructure resources and costs are modeled within the platform.
Licensing Capacity and Consumption #
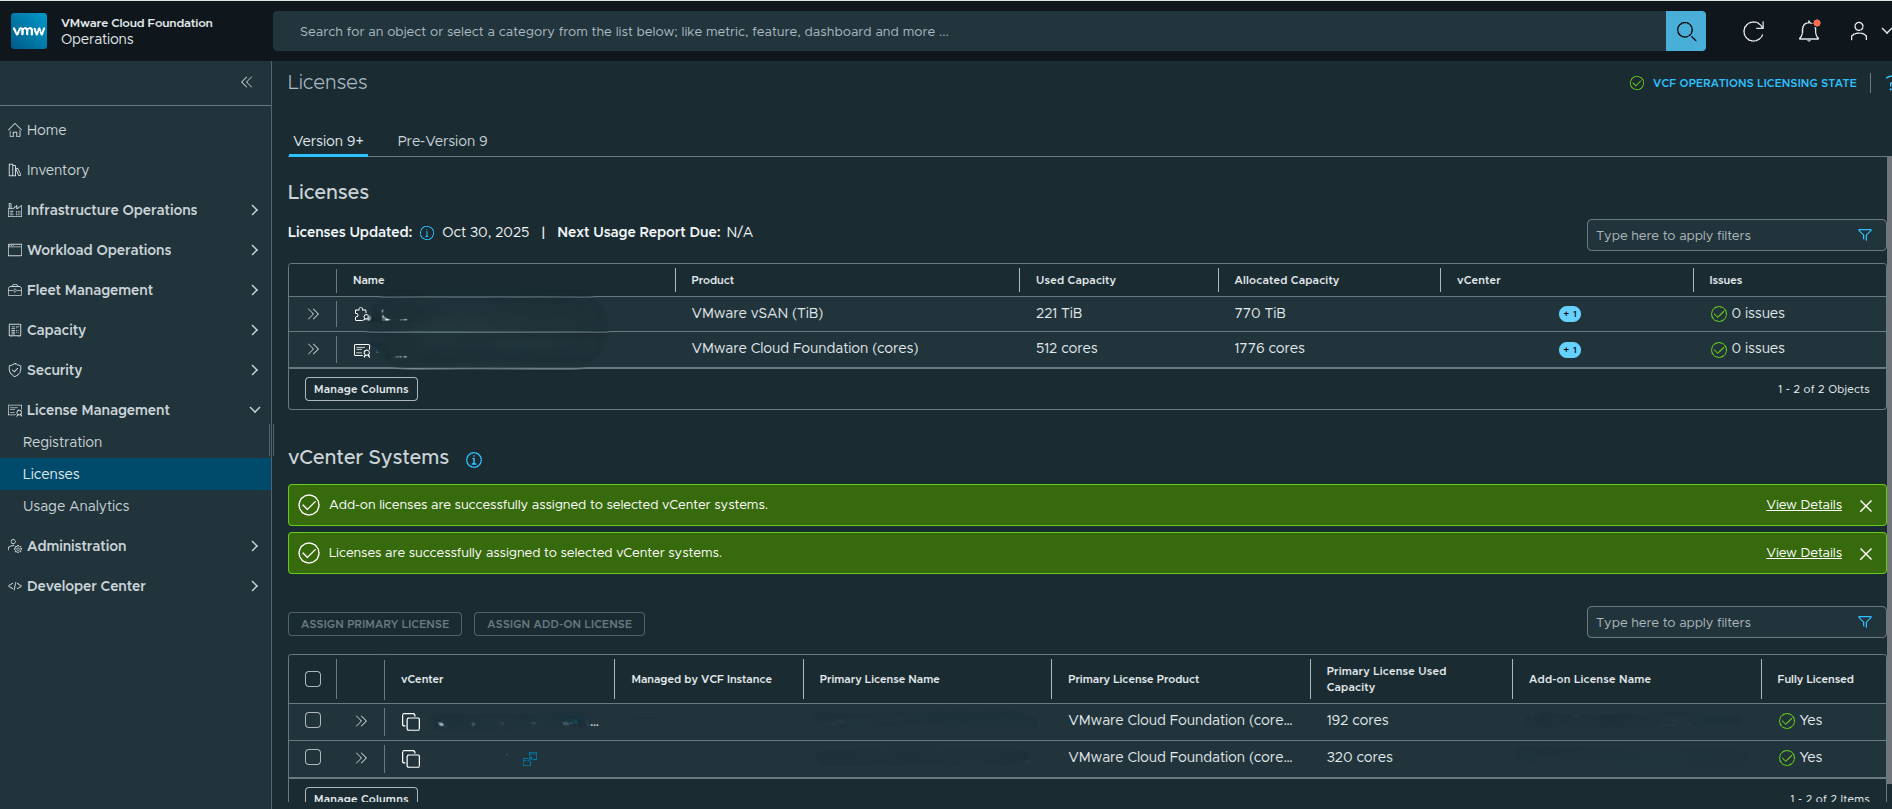
Figure 1: VMware Cloud Foundation Operations licensing dashboard showing total licensed cores and current core consumption across the environment.
The licensing view provides visibility into the total licensed capacity and current utilization across the environment.
In this environment:
- Total licensed cores: 1776
- Currently consumed cores: 512
VMware Cloud Foundation licensing is typically purchased as a pool of cores. As hosts are added to clusters and workloads are deployed, those hosts consume from the licensed core capacity.
The licensing dashboard allows administrators to quickly determine how much of the licensed capacity is currently in use and how much headroom remains available for future infrastructure expansion.
It is important to understand that this system tracks capacity utilization, not the actual contract value of the licenses. The financial modeling of infrastructure cost is handled separately through cost drivers.
License Usage Analytics #
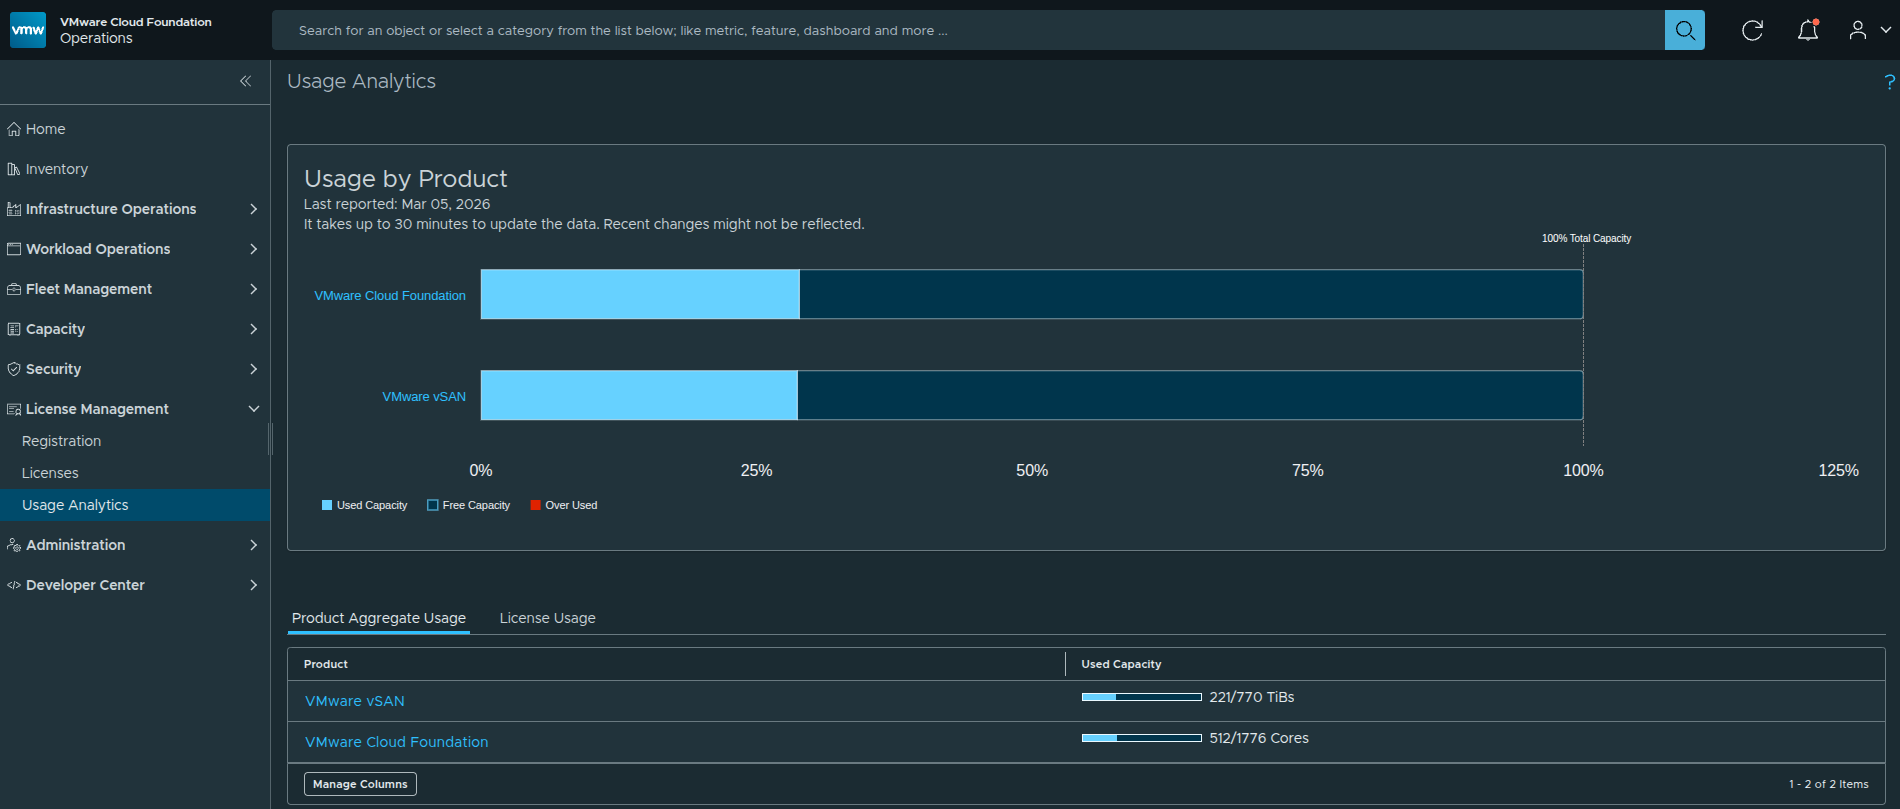
Figure 2: Usage analytics dashboard showing platform capacity utilization for VMware Cloud Foundation and vSAN resources.
While the licensing dashboard provides visibility into total licensed core capacity, the usage analytics view offers additional insight into how infrastructure resources are consumed across the platform.
This dashboard shows capacity utilization for key components of the VMware Cloud Foundation environment, including:
- VMware Cloud Foundation compute capacity
- vSAN storage capacity
- overall platform resource utilization
These analytics help administrators understand how much of the licensed platform capacity is currently being utilized and how much capacity remains available for future workloads.
In the example environment shown above, approximately 29 percent of licensed cores are currently in use, indicating that significant capacity remains available before additional licensing would be required.
How Core Licensing Is Calculated #
VCF licensing is calculated based on the physical CPU cores installed in each ESXi host. Each physical core requires a corresponding license entitlement.
To determine how many cores are required for a host, multiply the number of CPUs by the number of cores per CPU.
Formula
Total Licensed Cores per Host = Number of CPUs × Cores per CPUFor example, consider a host with the following hardware configuration:
- 2 physical CPUs
- 32 cores per CPU
The required licensing would be:
2 CPUs × 32 cores = 64 licensed coresIf this host is added to a cluster managed by VMware Cloud Foundation, 64 cores would be consumed from the licensing pool.
Example Cluster Consumption #
If a cluster contains 8 hosts with the same hardware configuration:
64 cores per host × 8 hosts = 512 licensed coresThis would consume 512 cores from the available licensing pool, which matches the usage reflected in the environment shown earlier in the licensing dashboard.
Visualizing Core Licensing Consumption #
Before calculating license consumption across clusters, it can be helpful to visualize how cores are counted at the host level.
Each ESXi host contributes its total physical CPU cores to the licensing pool.
+---------------------+
|        Host 1       |
|---------------------|
| CPU 1: 32 cores     |
| CPU 2: 32 cores     |
|                     |
| Total: 64 cores     |
+---------------------+

+---------------------+
|        Host 2       |
|---------------------|
| CPU 1: 32 cores     |
| CPU 2: 32 cores     |
|                     |
| Total: 64 cores     |
+---------------------+

+---------------------+
|        Host 3       |
|---------------------|
| CPU 1: 32 cores     |
| CPU 2: 32 cores     |
|                     |
| Total: 64 cores     |
+---------------------+
As hosts are added to a cluster, the total licensed core consumption increases accordingly.
For example:
64 cores per host × 8 hosts = 512 licensed coresThis consumption is reflected in the VMware Cloud Foundation Operations licensing dashboard, where the total available core capacity is compared against the currently consumed cores across the environment.
Because licensing is tracked as a shared pool, administrators can easily determine how much licensed capacity remains available before additional hosts or clusters are deployed.
Why This Matters #
Tracking core consumption at the host level allows administrators to understand:
- how much licensed capacity is currently in use
- how much headroom remains for additional hosts
- how cluster expansion will impact license consumption
This visibility is especially useful when planning future infrastructure growth or validating that sufficient licensing capacity exists before adding new hosts to the environment.
Practical Tip for Administrators #
When planning infrastructure growth, administrators should evaluate host hardware specifications and calculate the total number of cores that will be introduced into the environment before adding new hosts to a cluster.
Because VMware Cloud Foundation licensing is consumed at the host level, even a small cluster expansion can significantly impact total core consumption depending on the CPU configuration of the new hardware.
Performing these calculations ahead of time helps ensure that sufficient licensing capacity is available before deploying additional infrastructure.
Total Cost of Ownership Model #
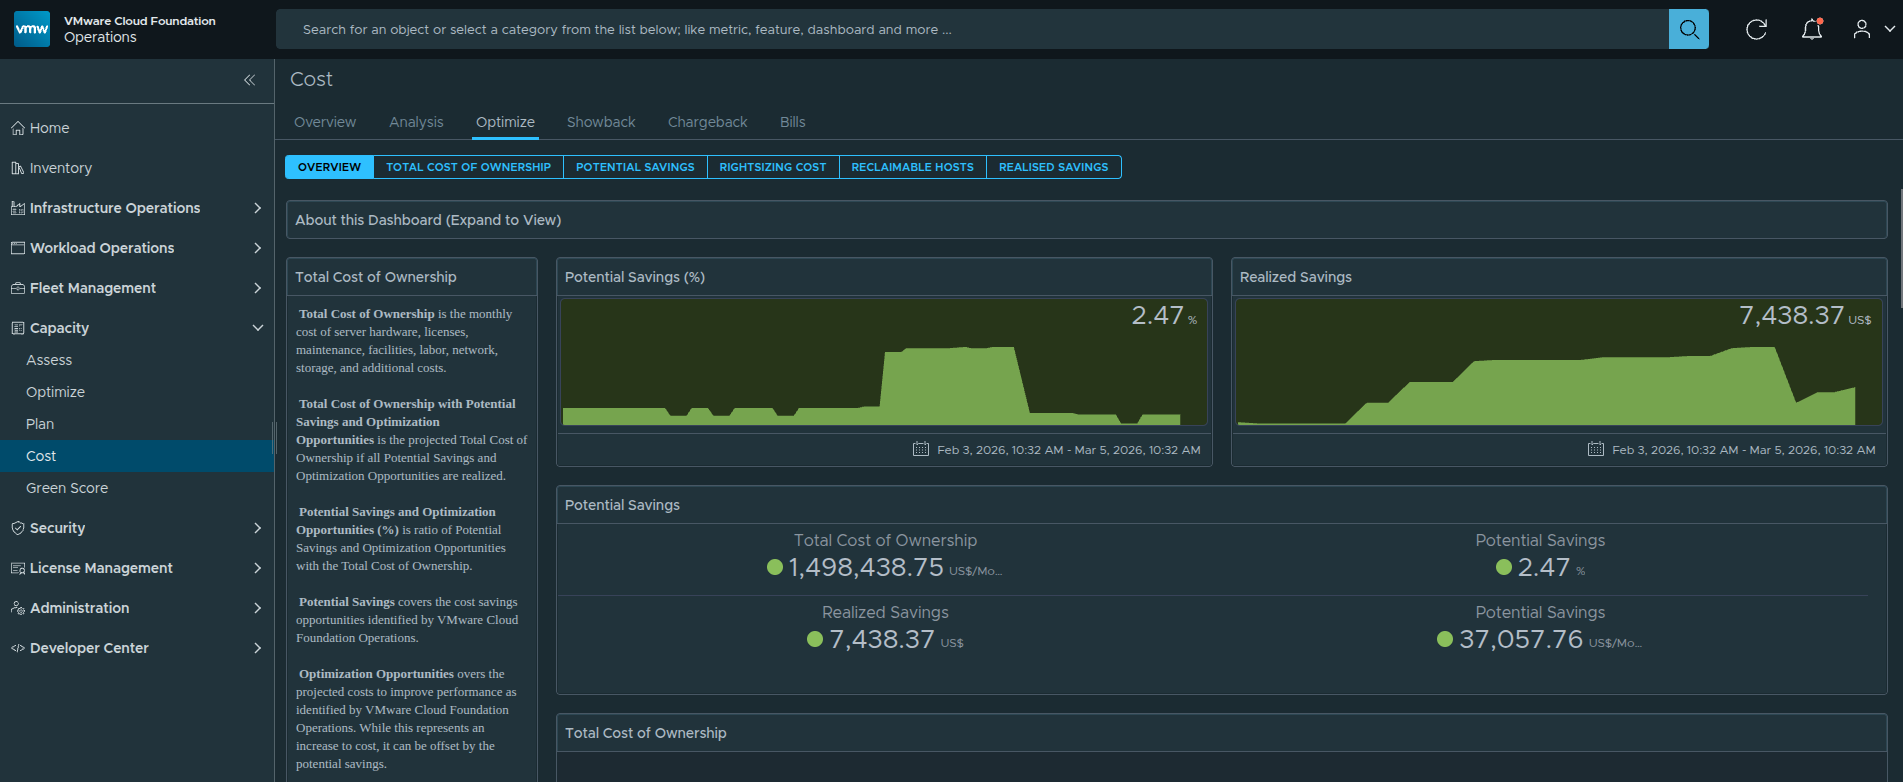
Figure 3: Total Cost of Ownership dashboard showing the aggregated monthly infrastructure cost modeled within VMware Cloud Foundation Operations.
Once licensing capacity and infrastructure resources are understood, the next step is determining how the platform translates those resources into an estimated infrastructure cost.
VMware Cloud Foundation Operations accomplishes this through a Total Cost of Ownership model, which estimates the monthly cost required to operate the private cloud platform.
Rather than pulling billing data directly from procurement systems or financial contracts, the platform builds this model using configurable cost drivers that represent the major categories of infrastructure expense.
These cost drivers are combined to produce the total monthly infrastructure cost pool for the platform.
Once the total cost pool is established, VMware Cloud Foundation Operations distributes that cost across clusters and workloads based on resource capacity and utilization.
This allows administrators and leadership to understand how infrastructure cost is distributed throughout the environment, even when exact procurement values are not directly integrated into the platform.
The next step is defining the individual cost drivers that make up this infrastructure cost model.
Cost Driver Configuration #
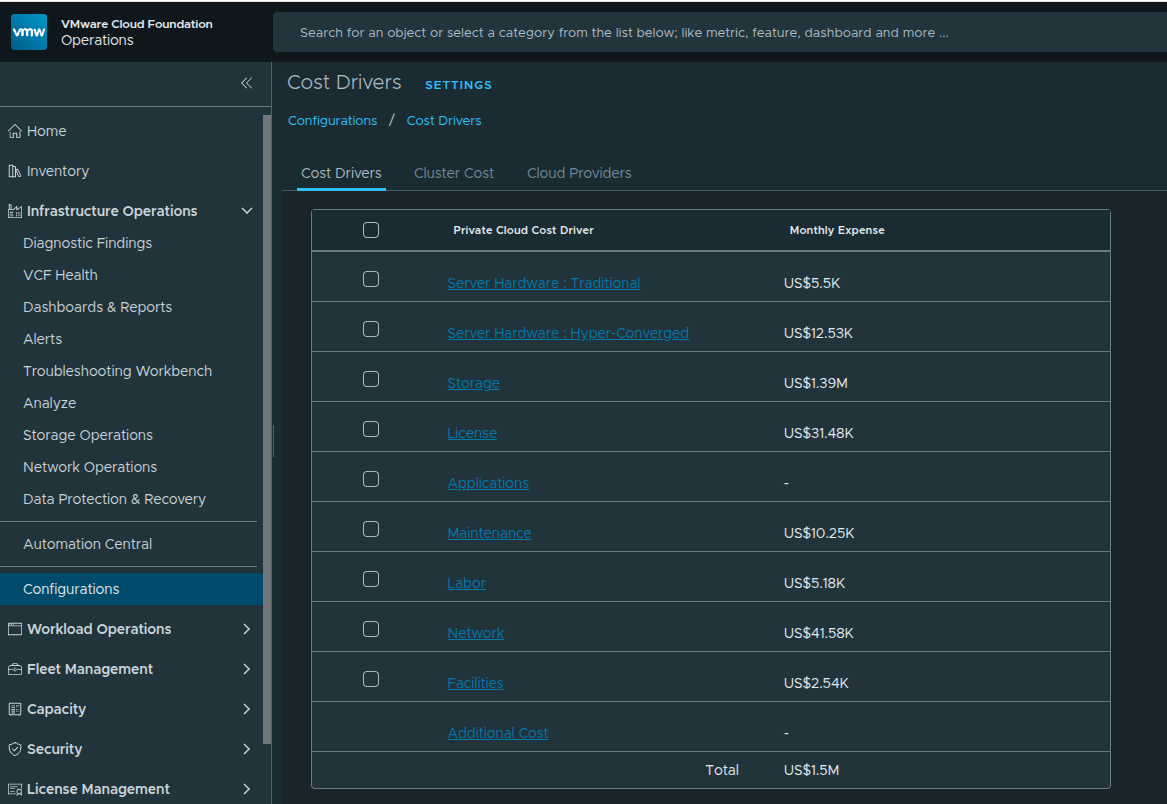
Figure 4: Example cost driver configuration used to define the infrastructure cost model.
Cost drivers represent the individual cost categories that contribute to the overall infrastructure operating cost.
Administrators define these values within VMware Cloud Foundation Operations as estimated monthly costs, allowing the platform to construct a realistic operating cost model for the environment.
Typical cost drivers often include categories such as:
- compute hardware
- storage infrastructure
- platform licensing
- network infrastructure
- maintenance contracts
- labor and operational support
- facilities and datacenter overhead
Each cost driver contributes a portion of the total monthly cost pool.
Once these drivers are configured, VMware Cloud Foundation Operations aggregates them to determine the overall infrastructure cost that will be distributed across clusters and workloads.
Cost Driver Contribution to Total Infrastructure Cost #
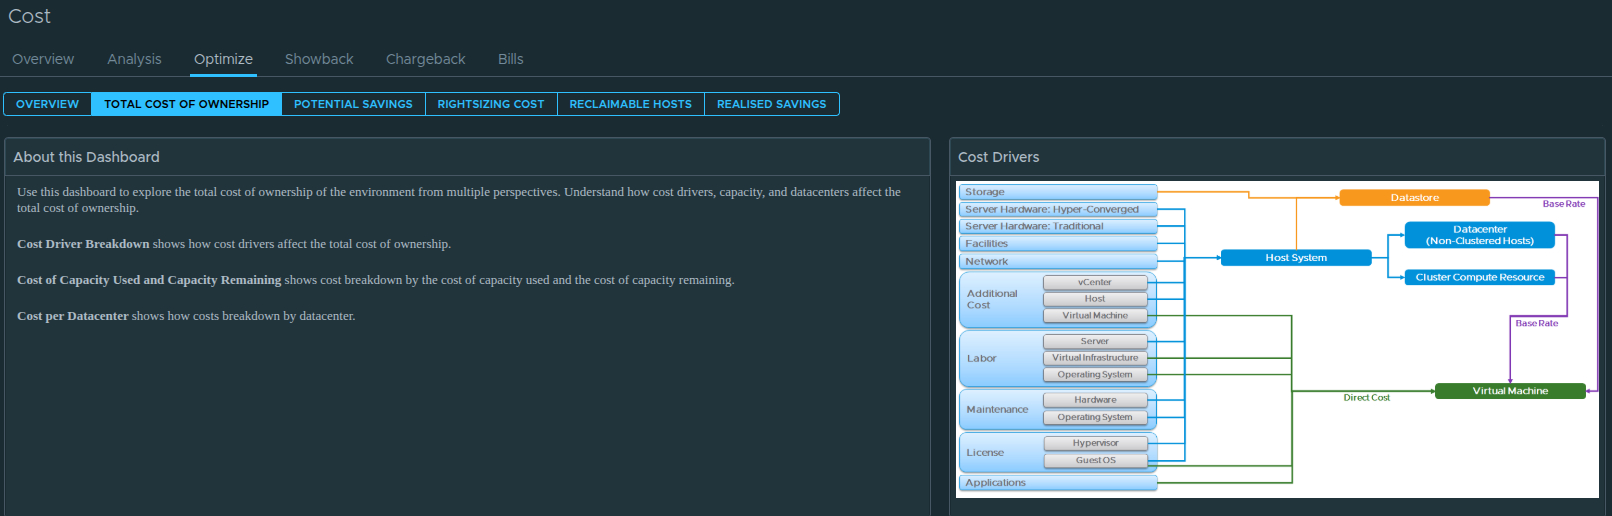
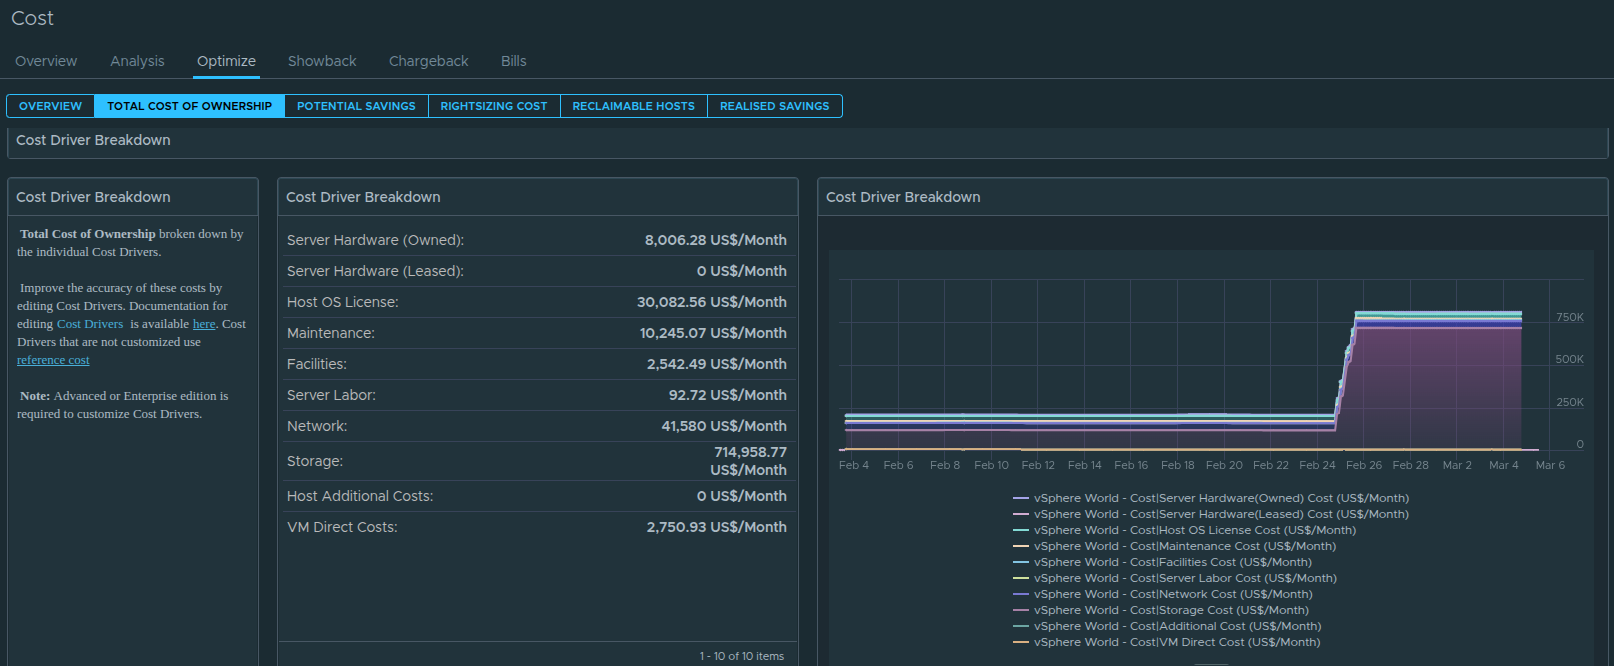
Figure 5: Breakdown of how each configured cost driver contributes to the overall infrastructure cost model.
After cost drivers are defined, VMware Cloud Foundation Operations aggregates them to determine the total infrastructure operating cost.
The platform then visualizes how each driver contributes to that overall cost.
In many enterprise environments, certain drivers tend to dominate the cost model. Storage infrastructure is often one of the largest contributors due to the large capacity requirements associated with enterprise workloads.
Compute hardware, licensing, and maintenance contracts typically represent additional major portions of the cost model.
Understanding how these cost categories contribute to the total infrastructure cost helps administrators identify which areas of the environment represent the largest operational expense.
This visibility becomes particularly valuable when evaluating infrastructure growth, hardware refresh cycles, or potential optimization opportunities.
Cluster Cost Calculation and Resource Base Rates #
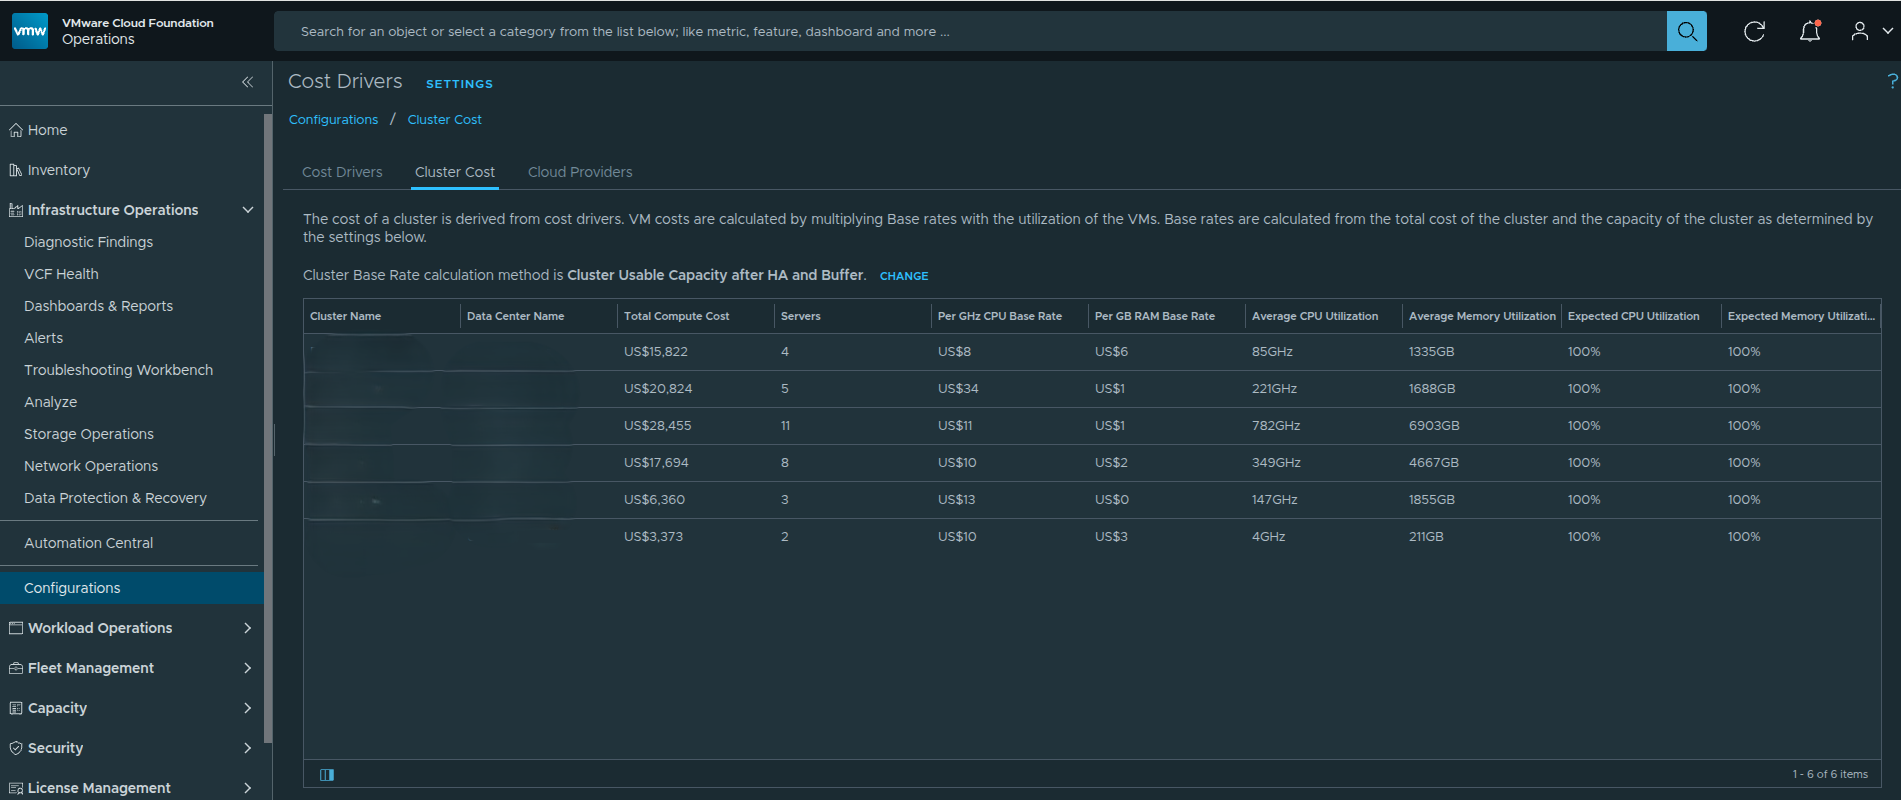
Figure 6: Cluster cost configuration showing how infrastructure cost is translated into resource base rates for CPU and memory consumption.
Once the total infrastructure cost has been defined through cost drivers, VMware Cloud Foundation Operations must determine how that cost is distributed across the platform’s compute resources.
This is accomplished by translating the infrastructure cost pool into resource base rates for each cluster.
These base rates represent the cost of consuming infrastructure resources, such as CPU and memory, within a given cluster.
To perform this calculation, VMware Cloud Foundation Operations evaluates the total usable capacity of the cluster and distributes the cluster’s portion of the infrastructure cost across those resources.
Several factors influence this calculation, including:
- total CPU capacity available in the cluster
- total memory capacity available in the cluster
- high availability reservations
- configured capacity buffers
After these factors are considered, the platform calculates base rate metrics such as:
- Cost per GHz of CPU
- Cost per GB of memory
- Cost per GB of storage
These values represent the estimated infrastructure cost associated with consuming those resources.
For example, if a cluster has a defined infrastructure cost and a known amount of usable CPU capacity, VMware Cloud Foundation Operations can calculate the cost associated with each unit of CPU consumed by workloads.
This allows the platform to translate raw infrastructure capacity into measurable cost metrics.
Why Resource Base Rates Matter #
Resource base rates serve as the foundation for translating infrastructure cost into workload cost.
Once base rates are established, the platform can estimate the cost of individual workloads by evaluating the amount of CPU, memory, and storage resources they consume.
For example, if the platform determines:
- Cost per GHz of CPU = $X
- Cost per GB of memory = $Y
- Cost per GB of storage = $Z
Then the estimated cost of a virtual machine can be calculated based on the resources allocated to that workload.
Estimated VM Cost =
(CPU Allocation × CPU Base Rate)
+ (Memory Allocation × Memory Base Rate)
+ (Storage Allocation × Storage Base Rate)
While the exact internal calculations within VMware Cloud Foundation Operations are more complex, this simplified model illustrates how infrastructure cost is translated into workload cost.
This approach enables administrators to understand how infrastructure consumption directly influences the cost associated with operating specific workloads.
Datacenter Cost Distribution #
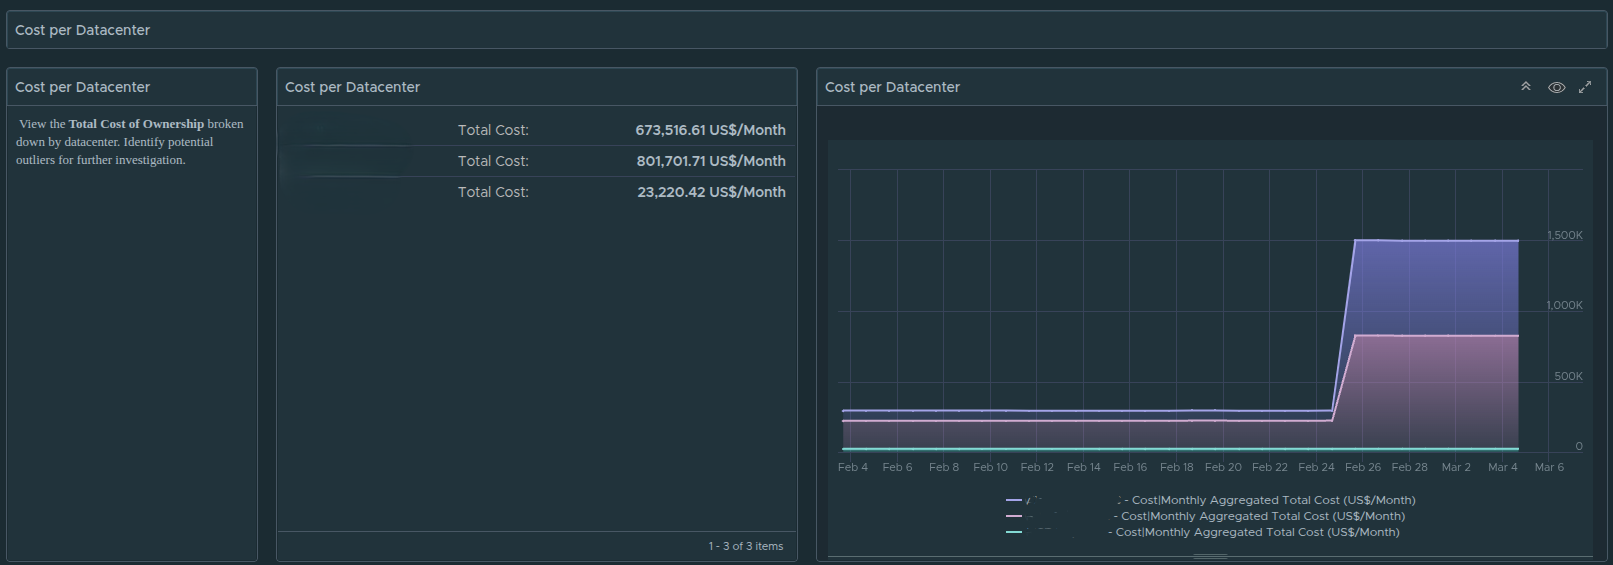
Figure 7: Datacenter-level cost distribution showing how infrastructure cost is allocated across clusters and workloads.
After cluster base rates are calculated, VMware Cloud Foundation Operations distributes the infrastructure cost across datacenters and clusters based on their capacity and resource utilization.
This allows administrators to visualize how infrastructure cost is distributed across the broader environment.
In large environments with multiple clusters and datacenters, this visibility becomes extremely valuable. It allows infrastructure teams to quickly identify:
- which clusters represent the largest portion of operational cost
- where infrastructure resources are most heavily consumed
- how platform growth impacts total infrastructure cost
This datacenter-level perspective helps organizations understand the broader operational footprint of their private cloud infrastructure.
Showback vs Chargeback Cost Models #
Before examining workload-level cost visibility, it is important to understand the difference between showback and chargeback cost models.
Both approaches attempt to associate infrastructure consumption with cost, but they serve different operational purposes.
In a chargeback model, departments or business units are billed directly for the infrastructure resources they consume. This approach treats the private cloud environment similarly to a public cloud provider, where resource consumption results in direct financial charges.
In contrast, a showback model focuses on visibility rather than billing.
Instead of generating invoices, the platform provides insight into how infrastructure resources are consumed across the organization. This allows teams and leadership to understand the financial impact of their workloads without implementing a formal billing system.
Showback models are commonly used in enterprise and federal environments where internal departments share infrastructure resources but are not billed directly for their usage.
This approach helps organizations understand:
- which workloads consume the most infrastructure resources
- how infrastructure capacity is utilized across platforms or departments
- where optimization opportunities may exist
Once this model is in place, VMware Cloud Foundation Operations can provide detailed visibility into workload-level infrastructure consumption.
Workload Level Showback #
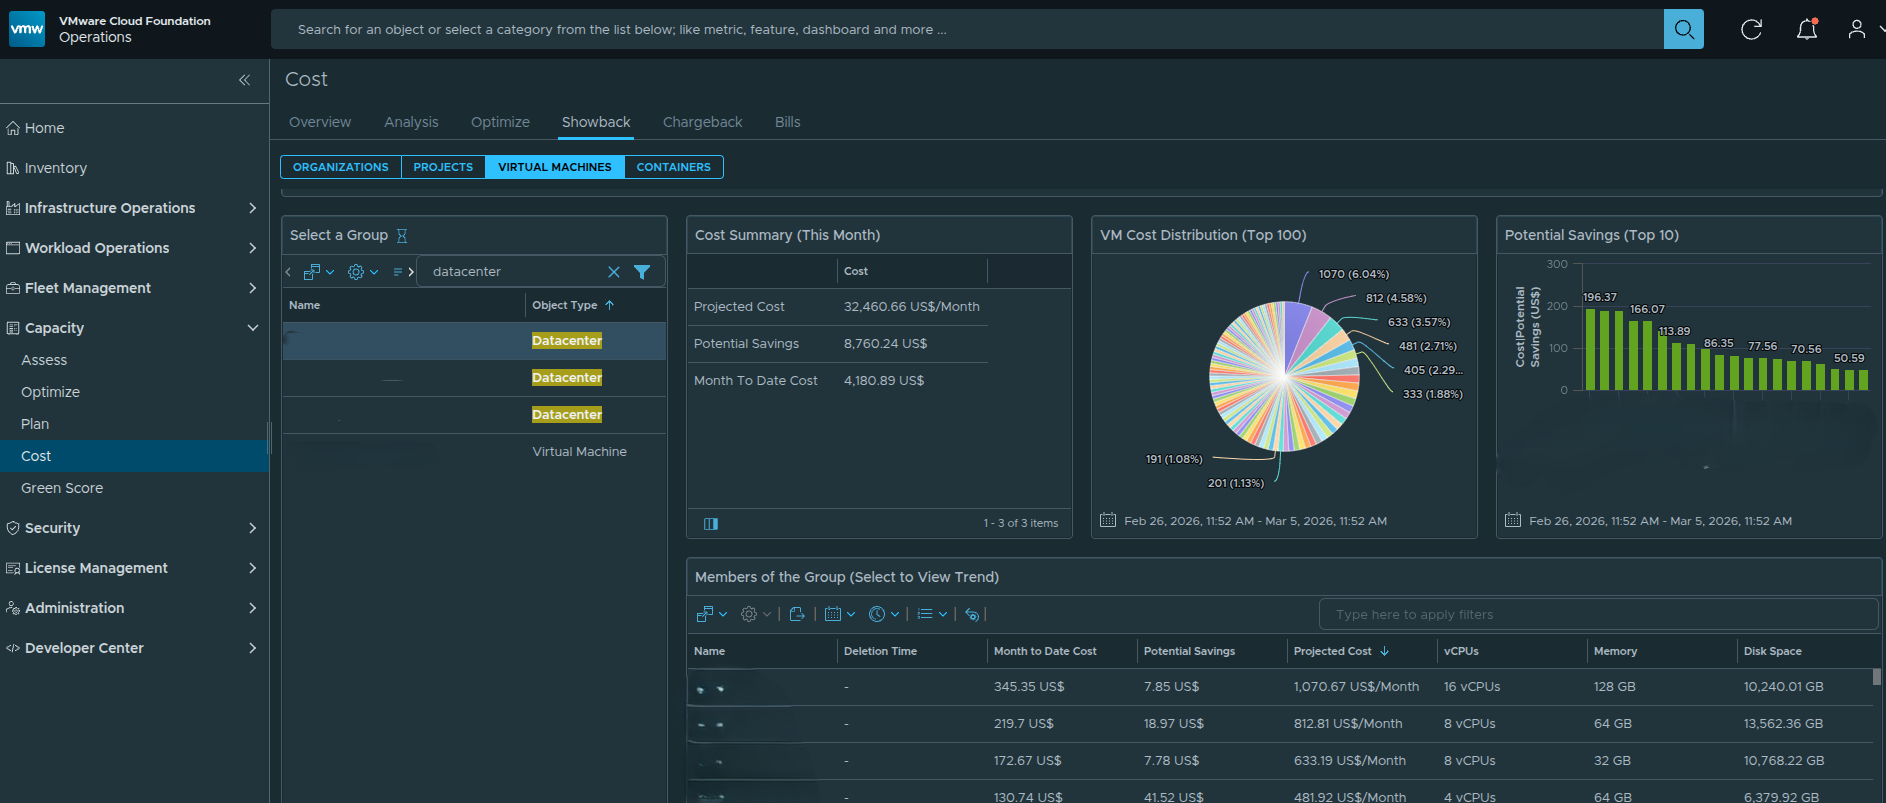
Figure 8: Workload-level showback dashboard displaying VM resource allocation and projected infrastructure cost. Environment identifiers have been sanitized for publication.
After infrastructure cost is translated into resource base rates, VMware Cloud Foundation Operations can begin estimating the cost of individual workloads.
This is where the cost model becomes most useful for administrators and leadership teams.
The showback dashboard provides workload-level visibility into how infrastructure resources are consumed across the environment. Instead of viewing cost only at the cluster or datacenter level, administrators can see how individual virtual machines contribute to the overall infrastructure cost.
For each workload, the dashboard can display metrics such as:
- allocated CPU resources
- allocated memory
- allocated storage capacity
- projected monthly infrastructure cost
- potential optimization savings
Because the cost model is derived from cluster resource base rates, the platform can estimate how much infrastructure cost is associated with each workload based on the resources it consumes.
This provides valuable insight into how infrastructure capacity is being utilized across the environment.
Identifying High Cost Workloads #
One of the most valuable capabilities of the showback dashboard is the ability to identify workloads that consume a disproportionate amount of infrastructure resources.
In large environments, hundreds or even thousands of virtual machines may be running across multiple clusters. Without a showback model, it can be difficult to determine which workloads are responsible for the largest share of resource consumption.
By viewing projected monthly infrastructure cost at the workload level, administrators can quickly identify:
- large virtual machines consuming significant CPU or memory resources
- workloads with excessive storage allocations
- systems that may be over-provisioned relative to their actual utilization
This visibility allows infrastructure teams to begin identifying optimization opportunities that may reduce overall platform cost.
For example, a virtual machine with large CPU and memory allocations but consistently low utilization may represent an opportunity for rightsizing, which could reduce both infrastructure consumption and estimated operational cost.
Applying the Model to Application Platforms #
Workload-level showback becomes especially valuable when evaluating the infrastructure footprint of specific application platforms.
For example, in the environment shown earlier, workloads associated with the Splunk platform are hosted within the example datacenter environment alongside other infrastructure workloads. The identifiers used in this article have been sanitized to remove environment-specific naming conventions while preserving the functionality of the dashboards.
Because VMware Cloud Foundation Operations tracks resource consumption for each virtual machine, administrators can easily identify the infrastructure footprint associated with these systems.
By filtering workloads based on naming conventions, tags, or application groupings, administrators can estimate:
- the total infrastructure resources consumed by a specific platform
- the projected infrastructure cost associated with that platform
- how the platform’s workload footprint compares to other systems in the environment
However, infrastructure consumption alone does not always represent the full cost of operating a platform. Many enterprise applications include additional software licensing costs that must also be considered.
Extending the Cost Model with Application Licensing #
While the default VMware Cloud Foundation Operations cost model focuses primarily on infrastructure cost, many organizations also need to account for software licensing costs associated with the platforms running on that infrastructure.
Examples may include:
- Splunk
- security monitoring platforms
- analytics platforms
- enterprise management tools
These platforms often have licensing models that are separate from infrastructure resource consumption. Instead of being tied directly to CPU, memory, or storage usage, licensing may be calculated based on:
- per server or per VM licensing
- annual subscription licenses
- perpetual platform licensing
- flat operational costs
VMware Cloud Foundation Operations allows administrators to incorporate these costs into the overall platform model by creating additional cost drivers.
Creating Additional Cost Drivers #
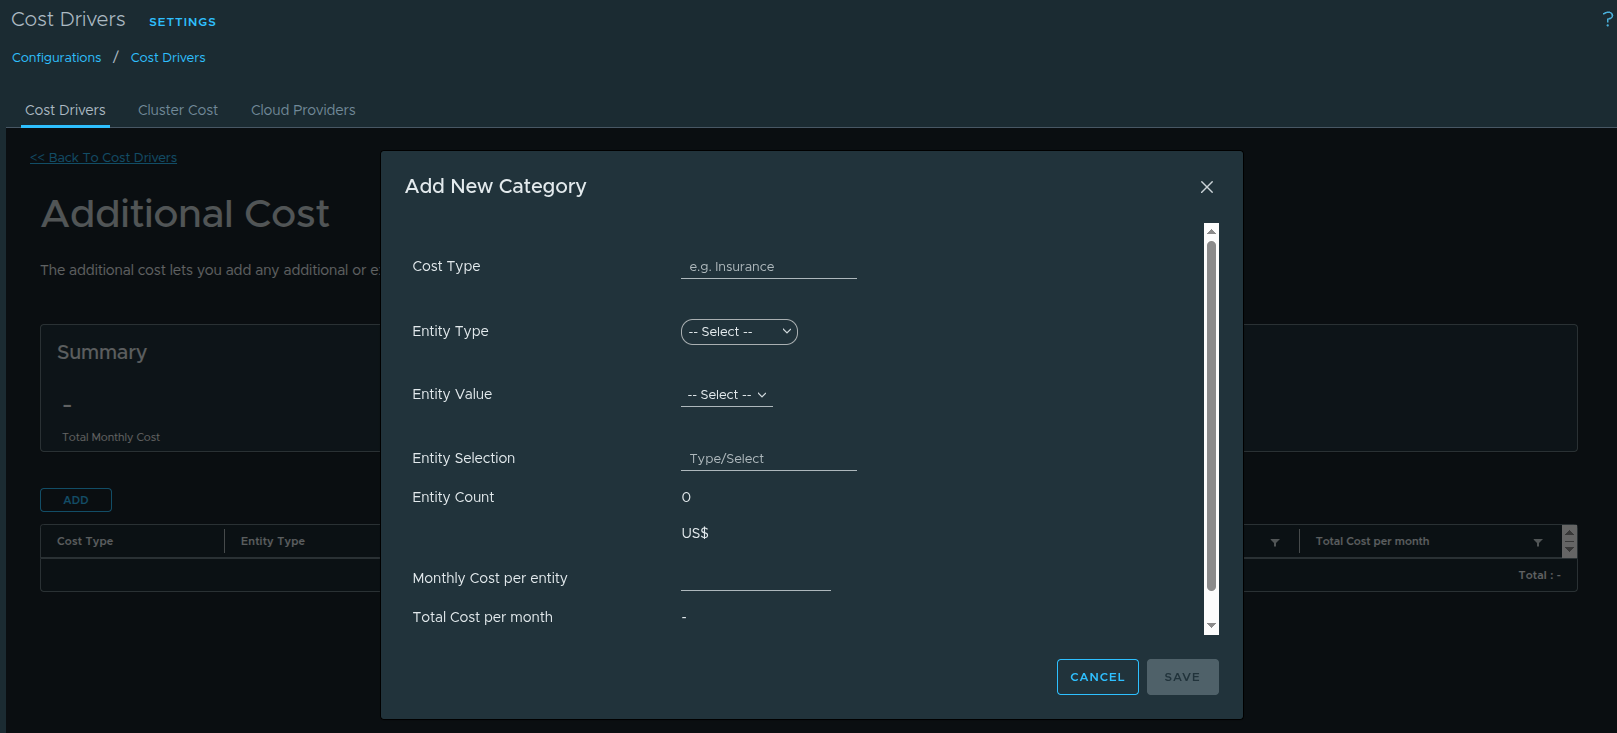
Figure 9: Creating additional cost drivers to represent application licensing costs.
Additional cost drivers can be created to represent licensing costs associated with specific application platforms.
In the example environment, the Splunk platform includes a licensing cost of:
$1200 per server per VM per yearBecause VMware Cloud Foundation Operations models cost on a monthly basis, the annual value must first be converted into a monthly cost.
For example:
$1200 per server per year ÷ 12 months = $100 per VM per monthOnce this monthly value is calculated, a new cost driver can be created representing the per-VM licensing cost associated with the platform.
Using Tags to Associate Workloads with Application Licensing #
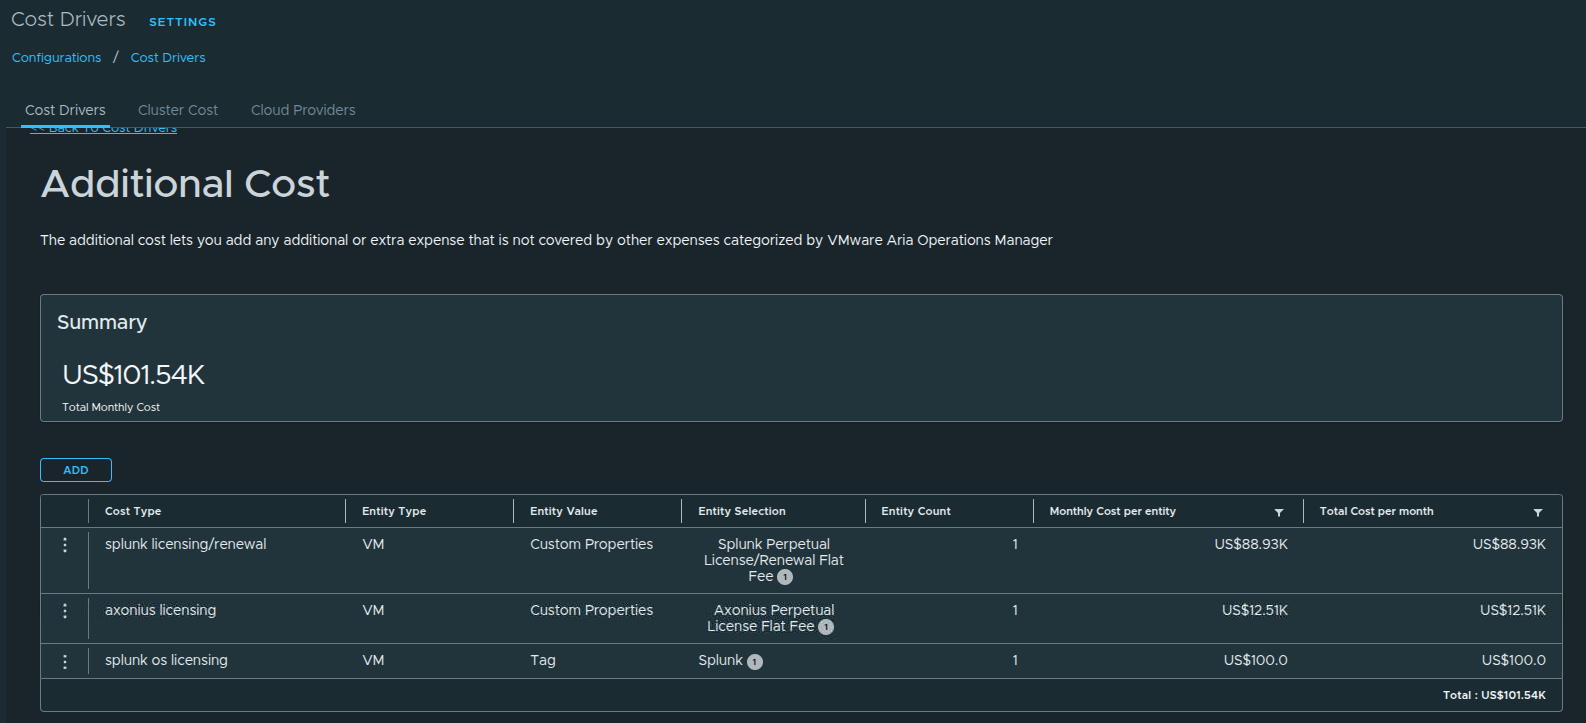
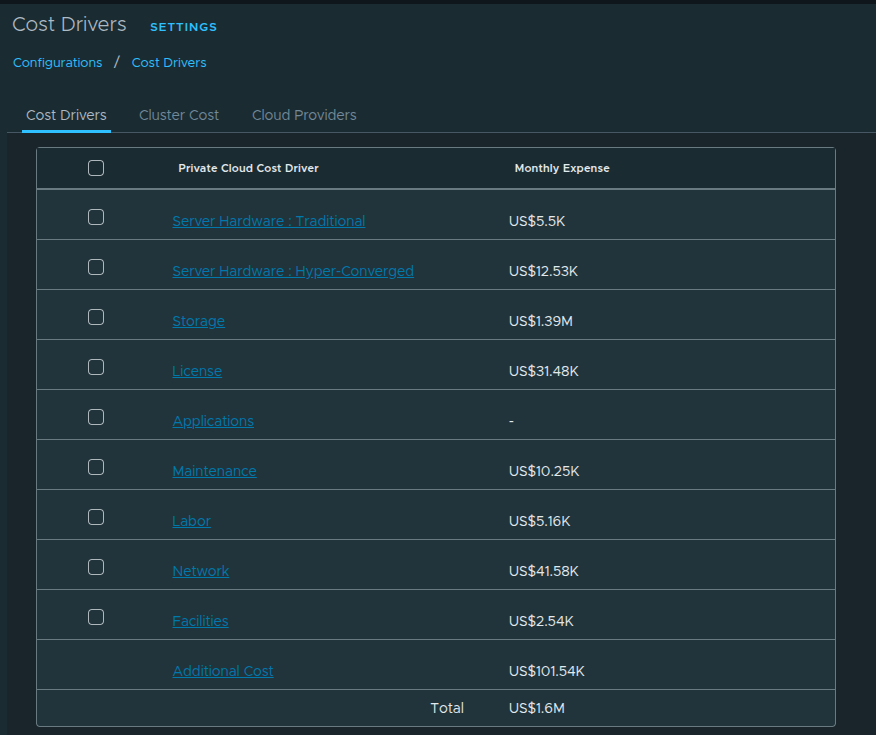
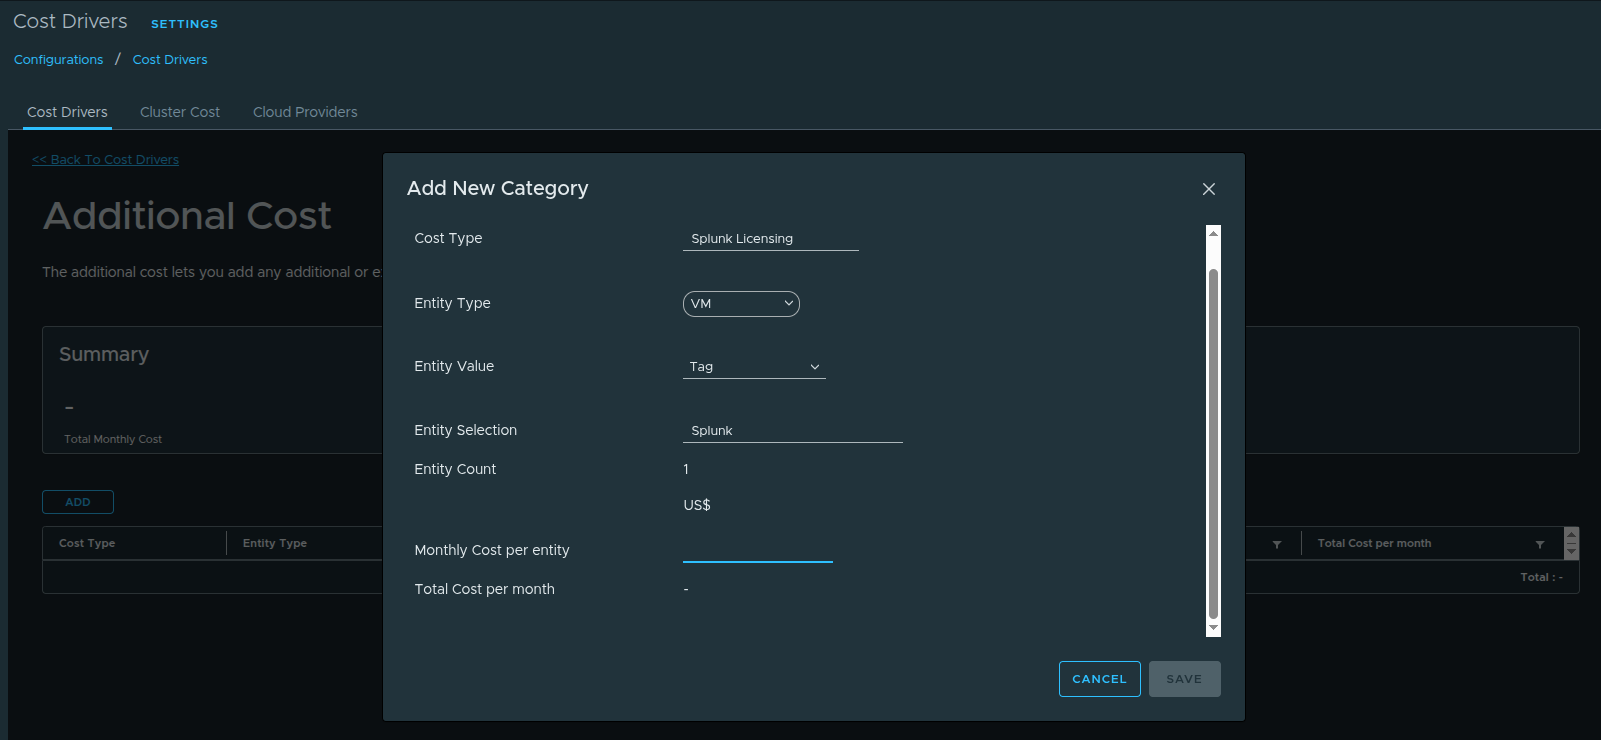
Figure 10: Associating application licensing cost drivers with workloads using tags.
For VMware Cloud Foundation Operations to apply this licensing cost correctly, the platform must be able to identify which virtual machines belong to the application platform.
This is accomplished using tags.
In this example, a tag named splunk is created and associated with the Splunk licensing cost driver. This tells VMware Cloud Foundation Operations that any virtual machine carrying this tag should have the additional licensing cost applied to it.
To complete the process, the same tag must also be applied to the appropriate virtual machines within the vSphere Client.
Administrators can assign the splunk tag directly to the virtual machines that belong to the Splunk platform. Once the tag is applied, VMware Cloud Foundation Operations can identify those workloads and include the additional licensing cost when calculating the total cost associated with those systems.
This allows the platform to represent the true operational cost of running the Splunk platform, including both infrastructure consumption and application licensing.
Modeling Flat Software Licensing Costs #
It is important to recognize that not all software licensing costs are tied to individual workloads.
Some platforms are licensed as flat operational costs, meaning the organization pays a fixed amount regardless of how many virtual machines are running the software.
In these cases, it may be more appropriate to add the software licensing cost directly to the infrastructure cost model without associating it with specific workloads.
When modeling flat operational costs, administrators can create an additional cost driver without applying tags to workloads. Instead, the cost can be incorporated into the platform’s overall cost pool using custom properties or general cost driver configuration.
This approach allows VMware Cloud Foundation Operations to represent the total operational cost of the platform, including both infrastructure and software licensing expenses, without incorrectly tying those costs to specific virtual machines.
Understanding the difference between per-workload licensing costs and flat operational licensing costs helps ensure that the cost model accurately reflects the financial structure of the environment.
Key Takeaways #
VMware Cloud Foundation Operations provides a powerful framework for understanding how infrastructure cost is distributed across workloads in a private cloud environment.
By combining licensing visibility, cost drivers, cluster base rate calculations, and workload level showback, administrators can gain a much clearer understanding of how infrastructure resources are consumed and where operational costs originate.
Key concepts covered in this article include:
- licensing capacity is based on physical CPU cores across ESXi hosts
- cost drivers define the infrastructure cost pool used by the platform
- cluster base rates translate infrastructure cost into resource cost metrics
- workload showback provides visibility into VM level infrastructure consumption
- additional cost drivers can extend the model to include application licensing costs
When implemented effectively, this approach allows organizations to better understand the operational footprint of their private cloud platform and identify opportunities to optimize infrastructure utilization.